




n.b.: This is how I began monitoring my energy costs using Dynatrace in the spring of 2025. I’ll explain in a future post how this workflow became much cleaner by deploying custom workflow actions!
If you’re interested in joining the same tariff I used in this example, consider using my Octopus referral code: dusk-shark-528
Here’s how the project came together, goal by goal…
The Big Picture: Four Goals
Before touching any code, I broke the project into four stages that mirror a classic data pipeline:
- Ingest — bring in the data
- Quantify — crunch the data using DQL and metrics
- Create Visibility — visualize it in a way that makes immediate sense
- Take Action — use the numbers to actually change behavior and make investments (tariffs, heating habits, battery storage)
Underneath all of it sat a fifth, ongoing thread: cost analysis — is it cheaper to heat with gas or electric, right now, today?
Goal 1: Observing the Data with Custom Ingest
The first challenge was getting data in at all. My home setup — SmartThings sensors, solar/wind generation data, live energy tariffs, climate information — doesn’t show up in Dynatrace out of the box the way infrastructure metrics do.
I went beyond OneAgent and built custom ingest using workflows, APIs, SDKs, and OpenPipeline. The key data sources I pulled together included:
- Live sensor readings (via SmartThings)
- Tariff details (via Octopus Energy)
- Solar/wind generation data (Ecoflow and Ripple Energy)
- Climate information
- General energy consumption
Ingesting SmartThings: Two Methods
SmartThings was my first challenge at the ingest layer. I actually went through two approaches:
Method 1: Scheduled PowerShell + API A scheduled task running a PowerShell script that hit the SmartThings API directly and ingested the results as classic Dynatrace metrics using the metric ingest protocol.
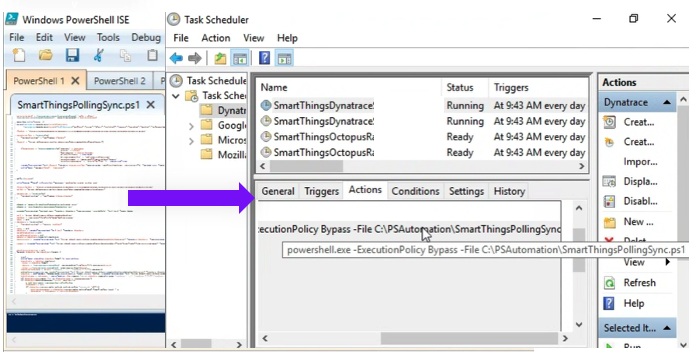
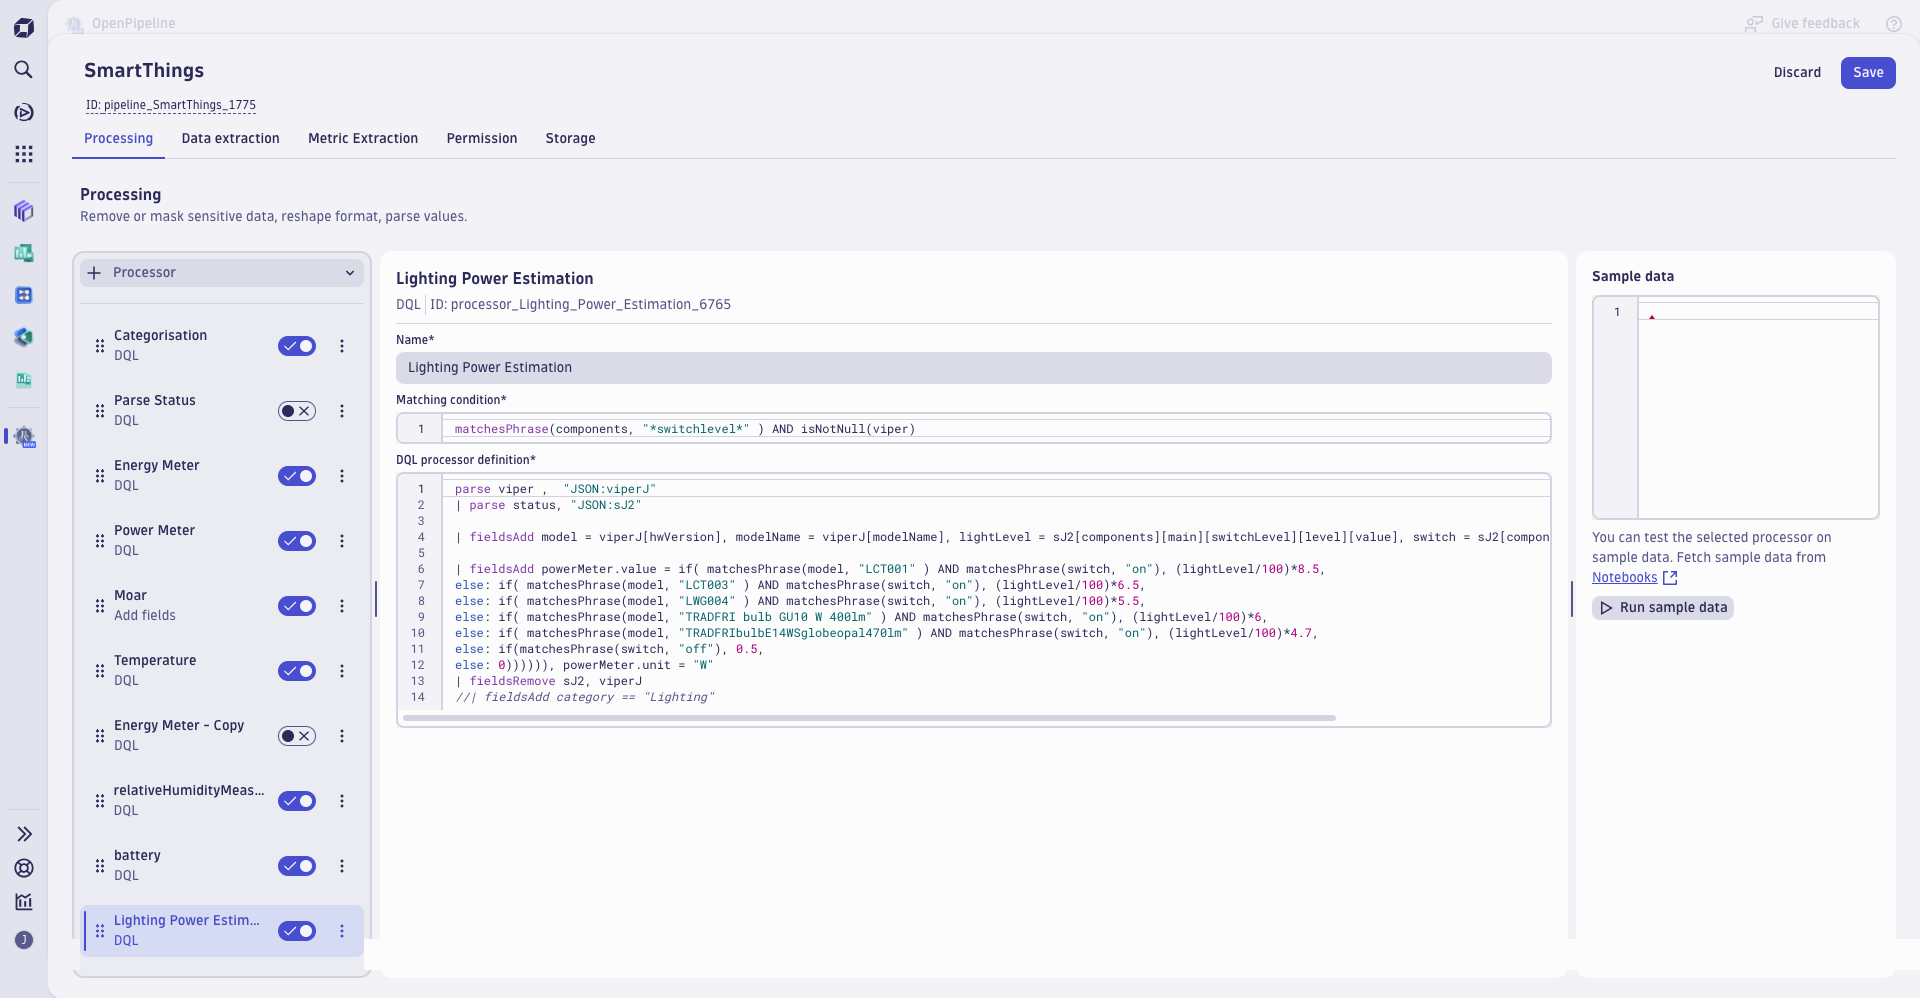
Method 2: Dynatrace Workflows Leveraging Dynatrace Workflows to poll the SmartThings API on a schedule, ingesting the results as BizEvents — eventually parsing everything through OpenPipeline with metric extraction instead.
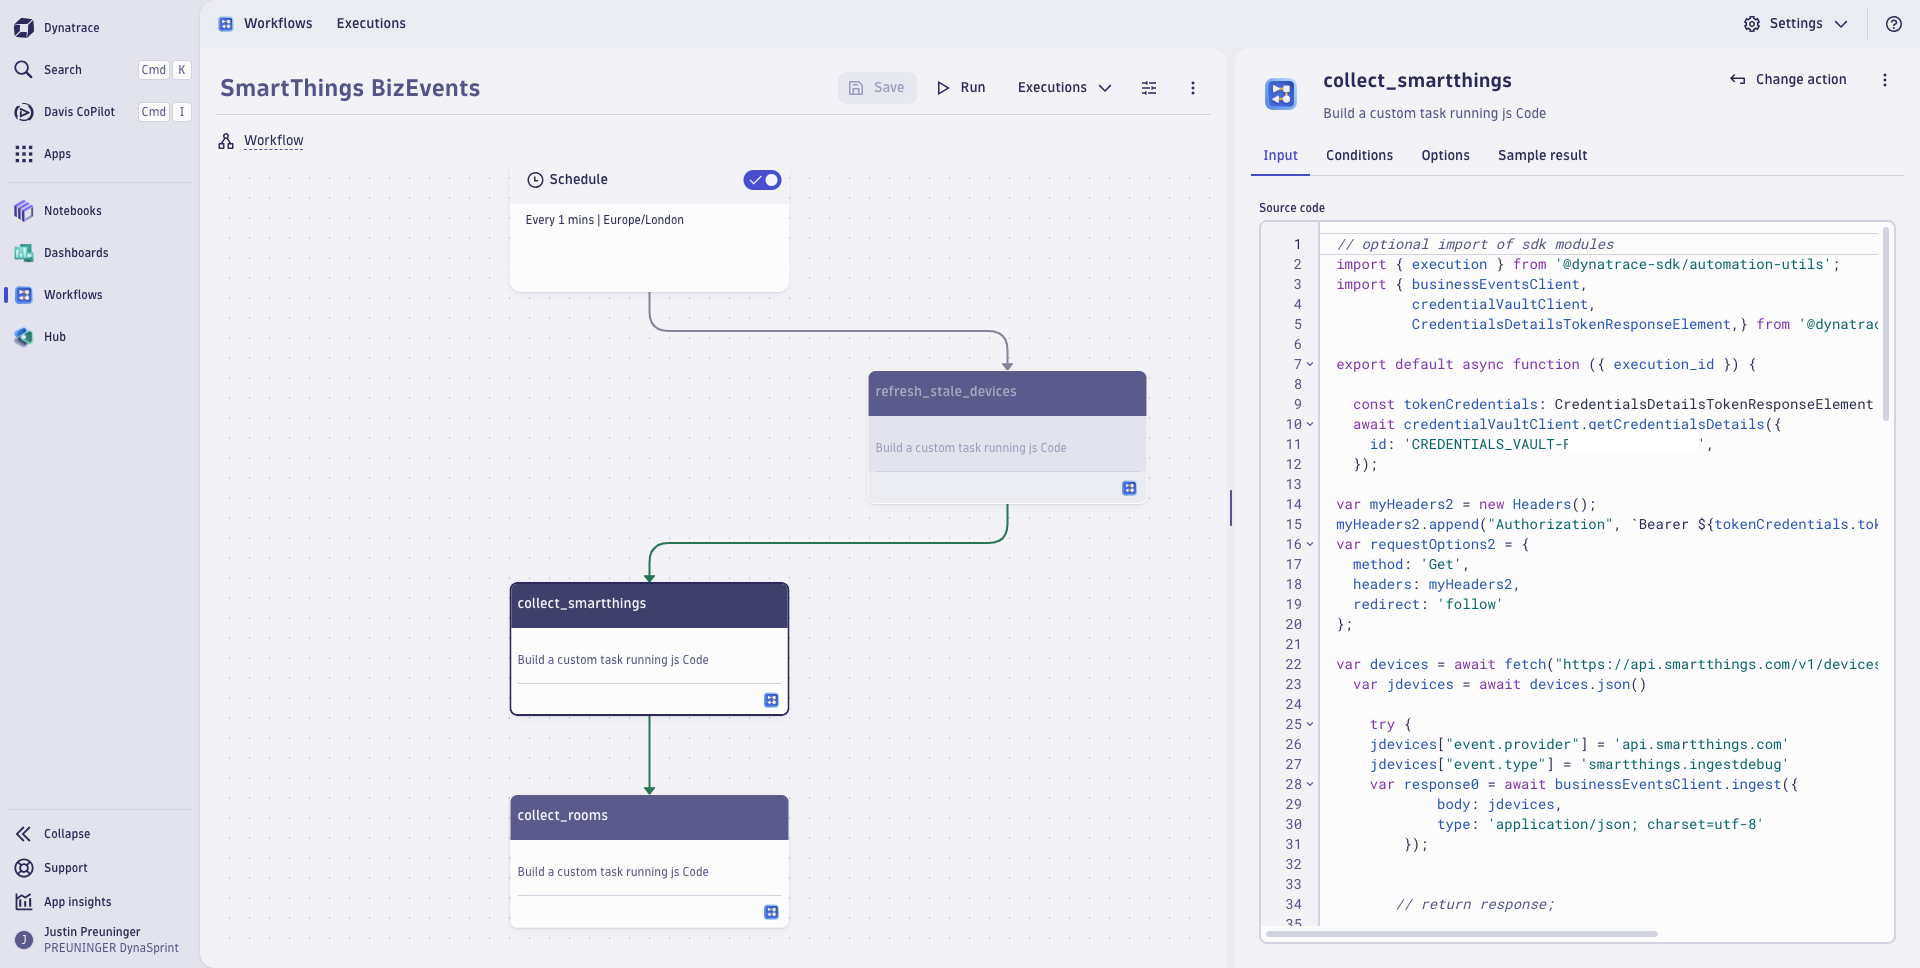 Note the use of the credentials vault to avoid credentials in raw text!
The shift to Workflows + OpenPipeline was a meaningful upgrade: less custom scripting to maintain, and a cleaner path from raw event to usable metric. Additionally, metrics were more cost-effective than bizevents. BizEvents remained more useful for process-related items, such as when I flagged a Smart Charge session.
Goal 2: Quantify and Parse the Data
Getting data in is only half the problem — the real work was learning to ask good questions of it using DQL (Dynatrace Query Language).
This turned into an ongoing exercise in improvements in query writing:
- Constant sanity checks and iteration on the data
- Learning to write efficient queries
- Working through timeseries, append and delta aggregations, and lookups
- Cutting through noise to get to signals
Every query taught me something new about both the data and DQL itself — this stage was as much about DQL enablement on real data as it was about the house. I find that I often learn best when I have a purpose, both because it is motivating, but also because you can sanity-check the results and confirm your understanding.
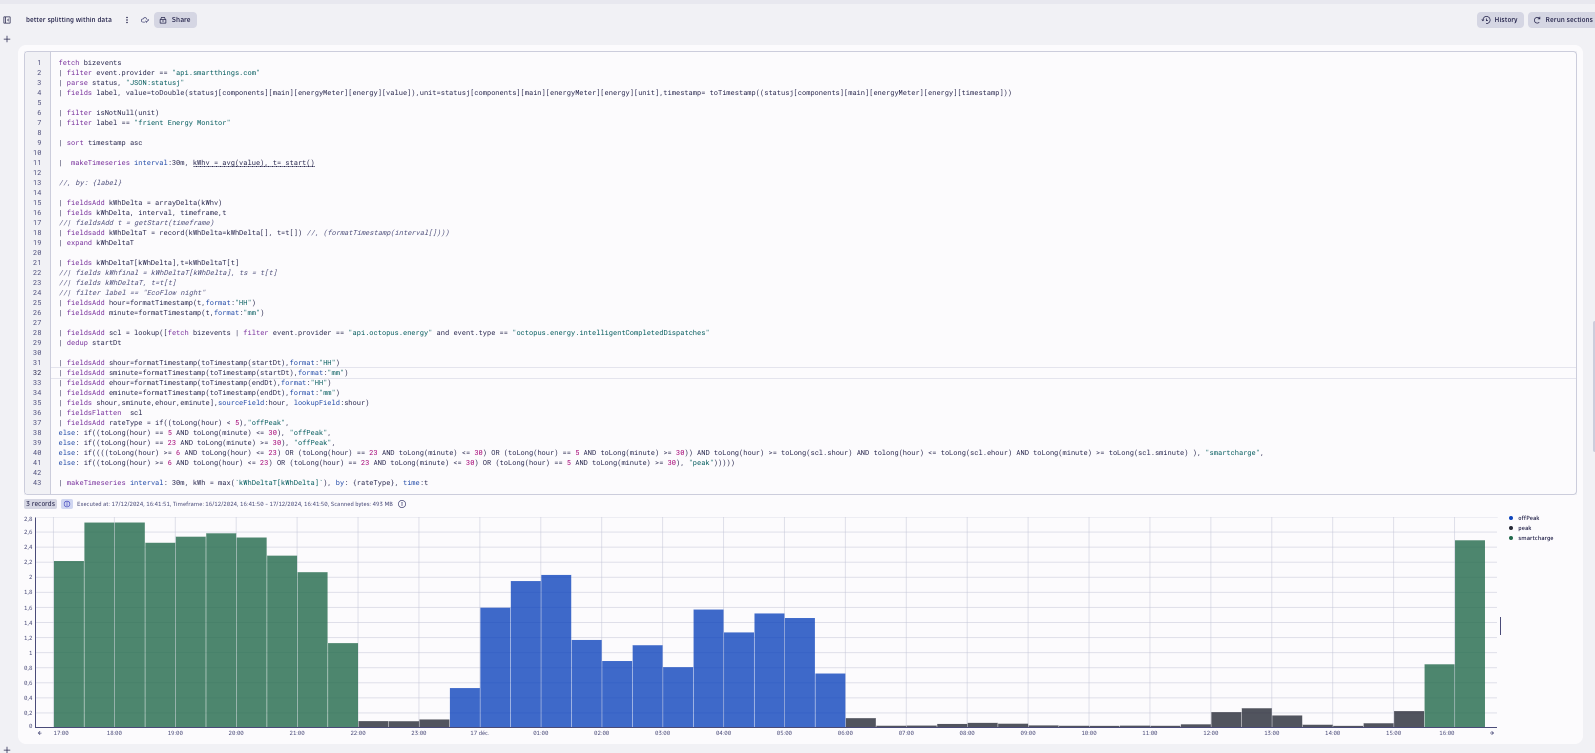 In this query, I used a combination of the time of day for peak/off peak energy rates as well as bizevents stored from querying Octopus Energy to flag times of the day when a Smart Charge had occurred. (Octopus Intelligent Go is a tariff that allows an EV charger to identify moments of the day when the grid is best suited for charging, which then unlocks cheaper energy.)
Goal 3: Visualizing — Long-Term and Immediately Actionable
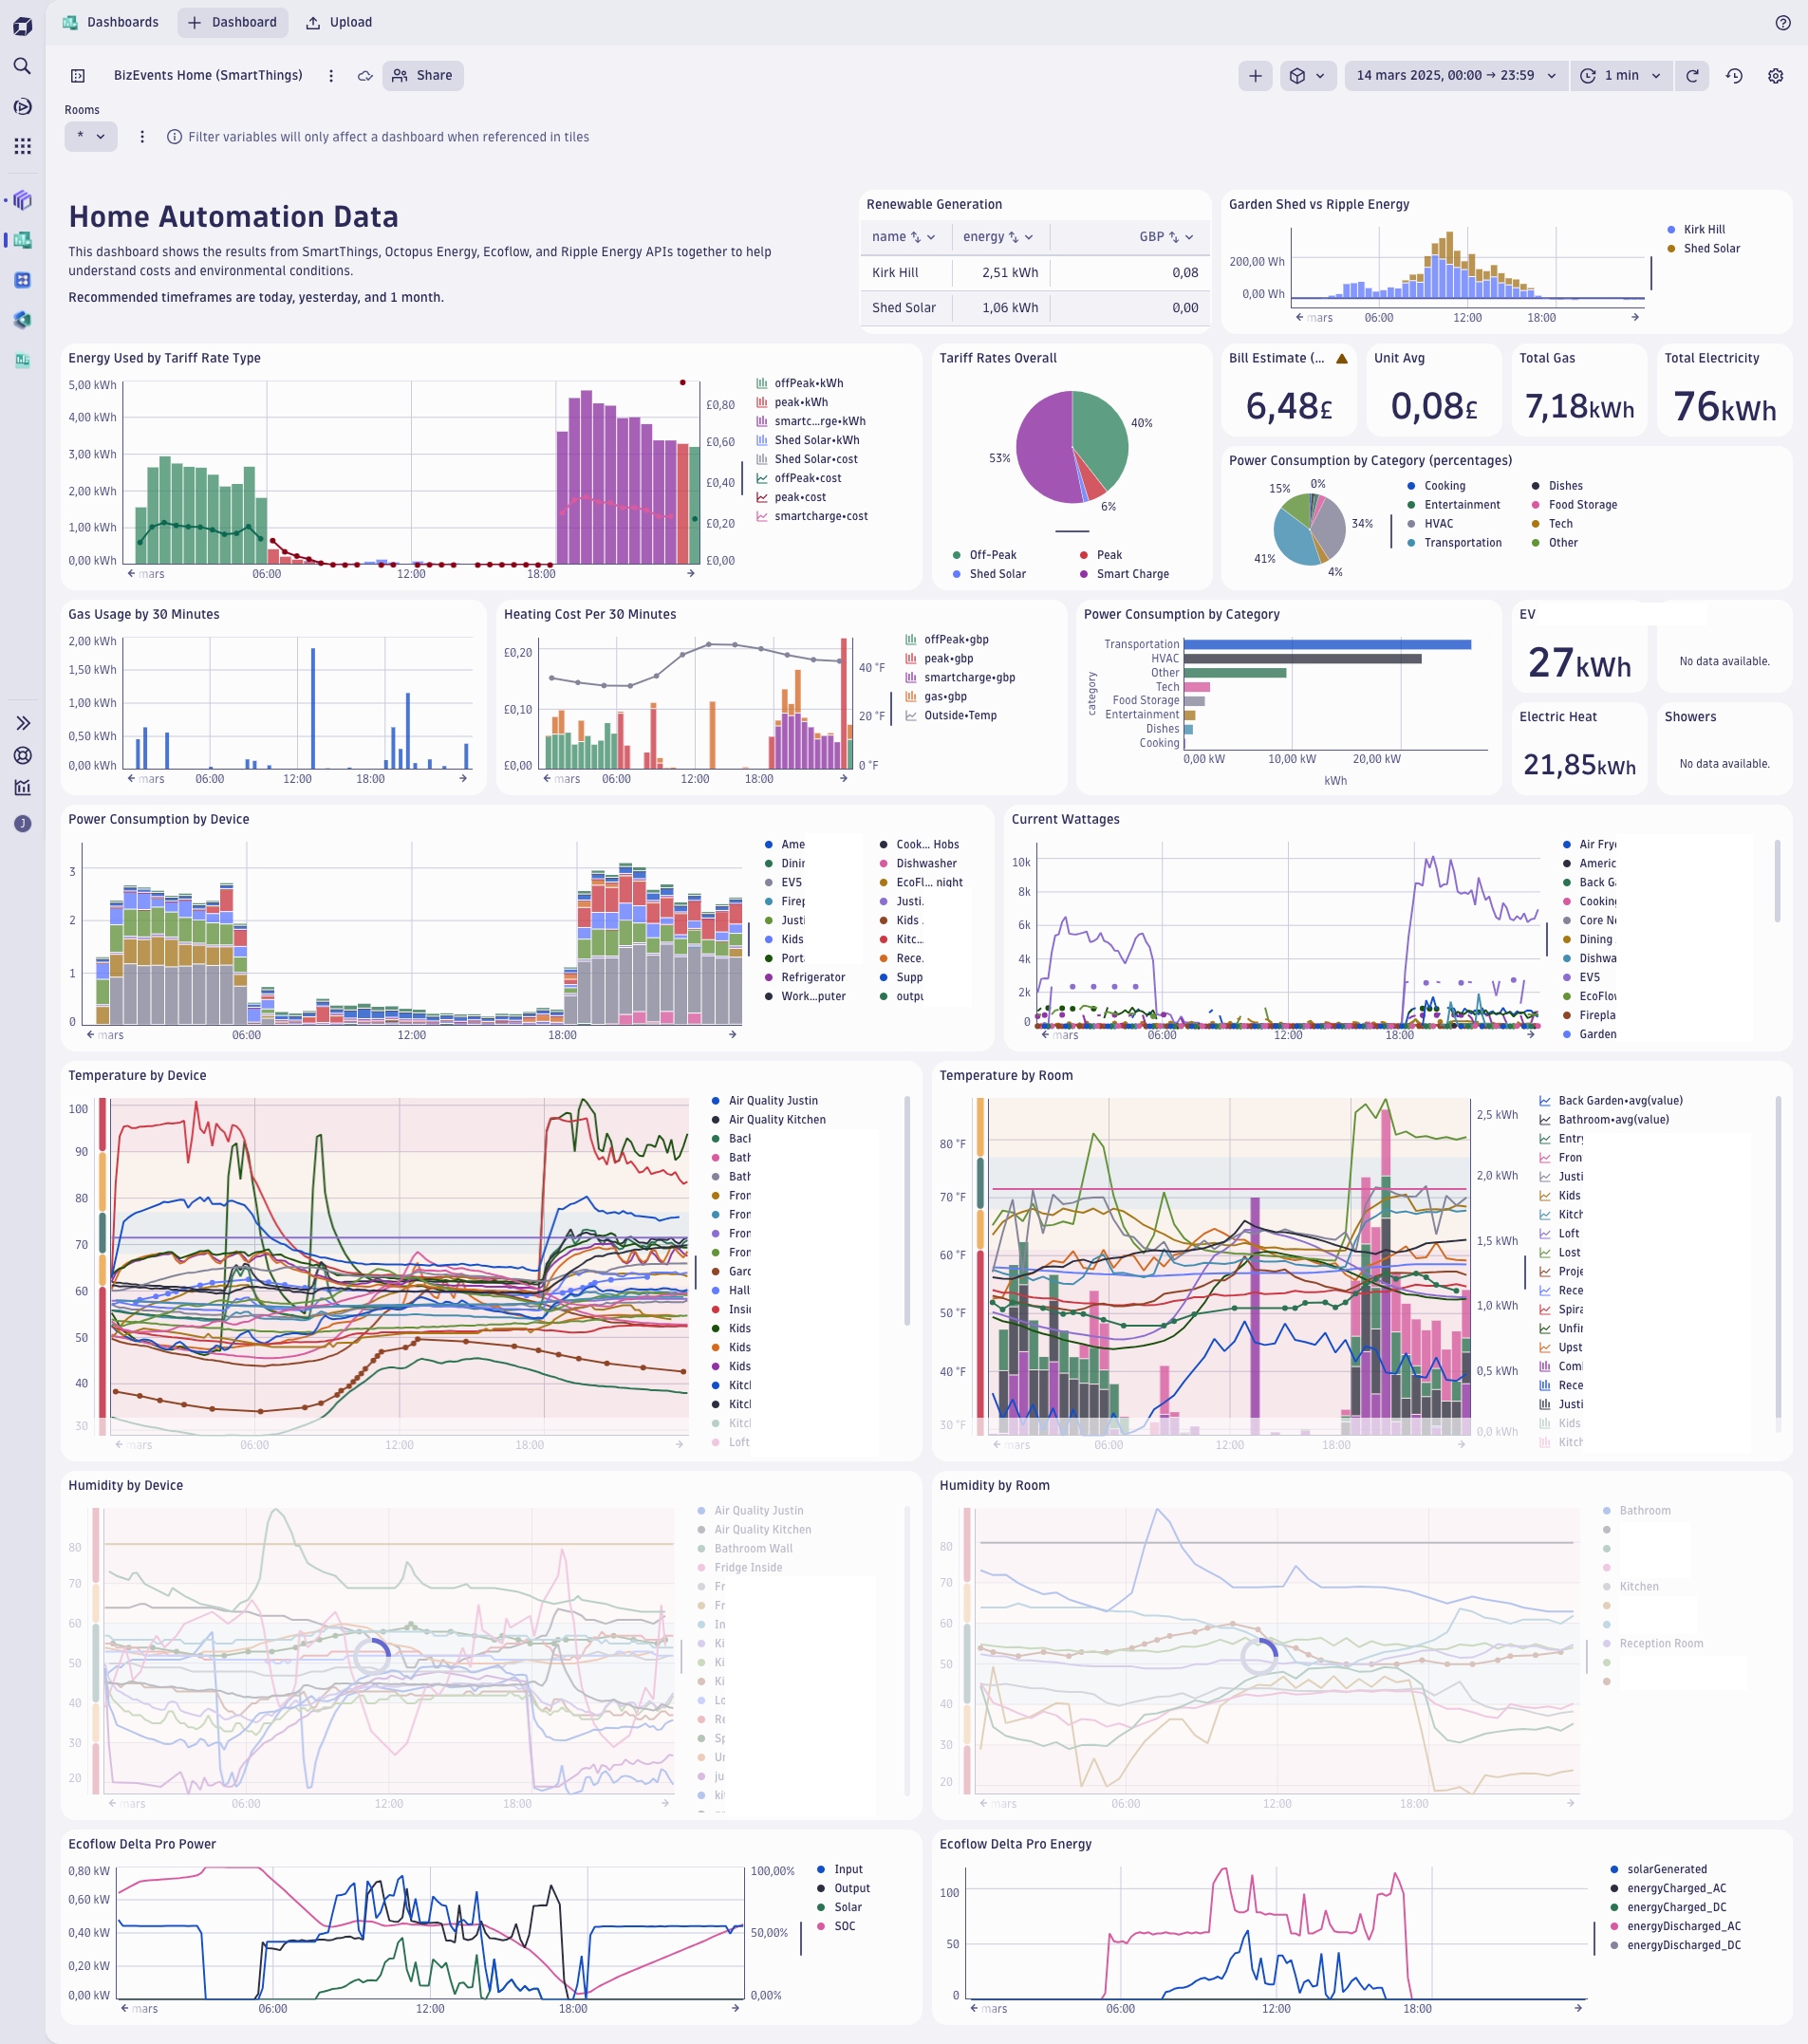
Raw numbers and queries don’t help if they don’t answer a question at a glance. So the next step was setting up dashboards and notebooks designed to answer one core question instantly:
Where is our energy being consumed right now?
I split visualizations into two categories:
- Immediately actionable — what’s happening right now that I can respond to today
- Long term — trends worth tracking over weeks and months
Goal 4: Budget Outcomes — Making It Tangible
This is where the project stopped being an interesting technical exercise and started paying for itself.
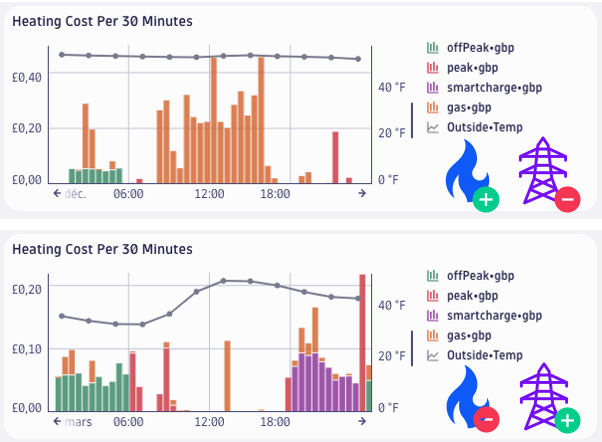
The core question: is it more expensive to heat the house with gas or electricity?
Using calculated energy use for heat pumps versus gas, and collected variable tariff information for electricity rates, I found:
- Gas was costing roughly 3x more per hour to run than electric heating
- This justified investing further in heat pumps and battery storage
- The result: a £40 reduction in gas costs and £15 off the total bill between December 2024 and January 2025
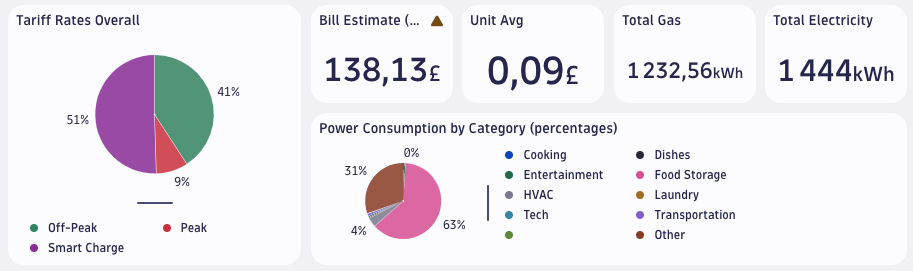
I also built automatic bill calculation into the pipeline, meaning:
- No need to wait for the actual bill to know if I’m on track for savings (Octopus Energy only introduced this feature into their own app in Summer 2026)
- Ability to iterate within each day to make the most of the best rates
Goal 5: Summary and Results
Taking data and turning it into action:
- Consciously chose to use less gas central heating and paid attention to shower length.
- Made a concerted effort to focus heat on rooms that were actually in use (whilst ensuring that I carefully tracked temperatures and humidity to avoid potential issues with plumbing or mould), and when possible, leaning on electric heat pumps combined with off-peak rates (overnight tariffs and aligning with EV smart charging periods).
- Invested in additional battery storage to shift more heating load to cheaper-rate windows, reducing depedence on smart charging availability and extending the run time of the energy shifted to lower rates.
The headline result: I pushed my off-peak energy usage from 85–95% up to 98%, bringing my average electricity rate down to 7.49p/kWh — compared to the energy price cap of 26.06p/kWh at the time. That’s a 71% reduction versus the capped rate.
What’s Next
A few directions I may consider in future:
- Live tariff comparison — automatically checking whether I’m still on the best available gas and electricity tariffs
- Investment amortization dashboards — tracking my battery/heat pump investment costs against savings versus the energy cap
- EV integration — tracking mileage and charging costs on the go
- DQL and GRAIL optimization — refining storage, retention, ingest, and query costs
What started as “let me see if I can pull my smart plug data into Dynatrace” turned into a genuinely useful home energy management system — built entirely on tools designed for infrastructure observability.
In a larger project, you could extend this to an entire office building, block of flats, or even an industrial estate. Oftentimes, commercial rates are much more sensitive than domestic ones to spikes in energy and time of day usage. Paired with an investment in solar and batteries, the reduction in energy costs is likely to be noticeable, not to mention the benefits of grid management and green credentials.